You get useful information when you check port crane: path planning kpis to show owners. CEGC gives market-standard specs and custom choices for portal cranes, container cranes, and other lifting tools. Owners use kpis to make safety, efficiency, durability, and maintenance better.
-
Simulation models look at kpi changes to help with efficiency and safety.
-
Industry standards make sure planning fits port needs.
Key Takeaways
-
Watch Crane Moves Per Hour (CMPH) to make work better. Try to get more than 30 moves each hour. This will help move cargo faster and stop delays.
-
Check Cargo Throughput to know how much your port can handle. More throughput means you move more goods and make more money.
-
Use Real-Time Productivity Tracking to find problems early. This helps you plan repairs and keep things running well.
Essential port crane path planning KPIs
When you look at port crane: path planning kpis to show owners, you can see how well your port works. Each key performance indicator gives you helpful data to make things safer and better. These KPIs help you find ways to improve your port and harbor operations.
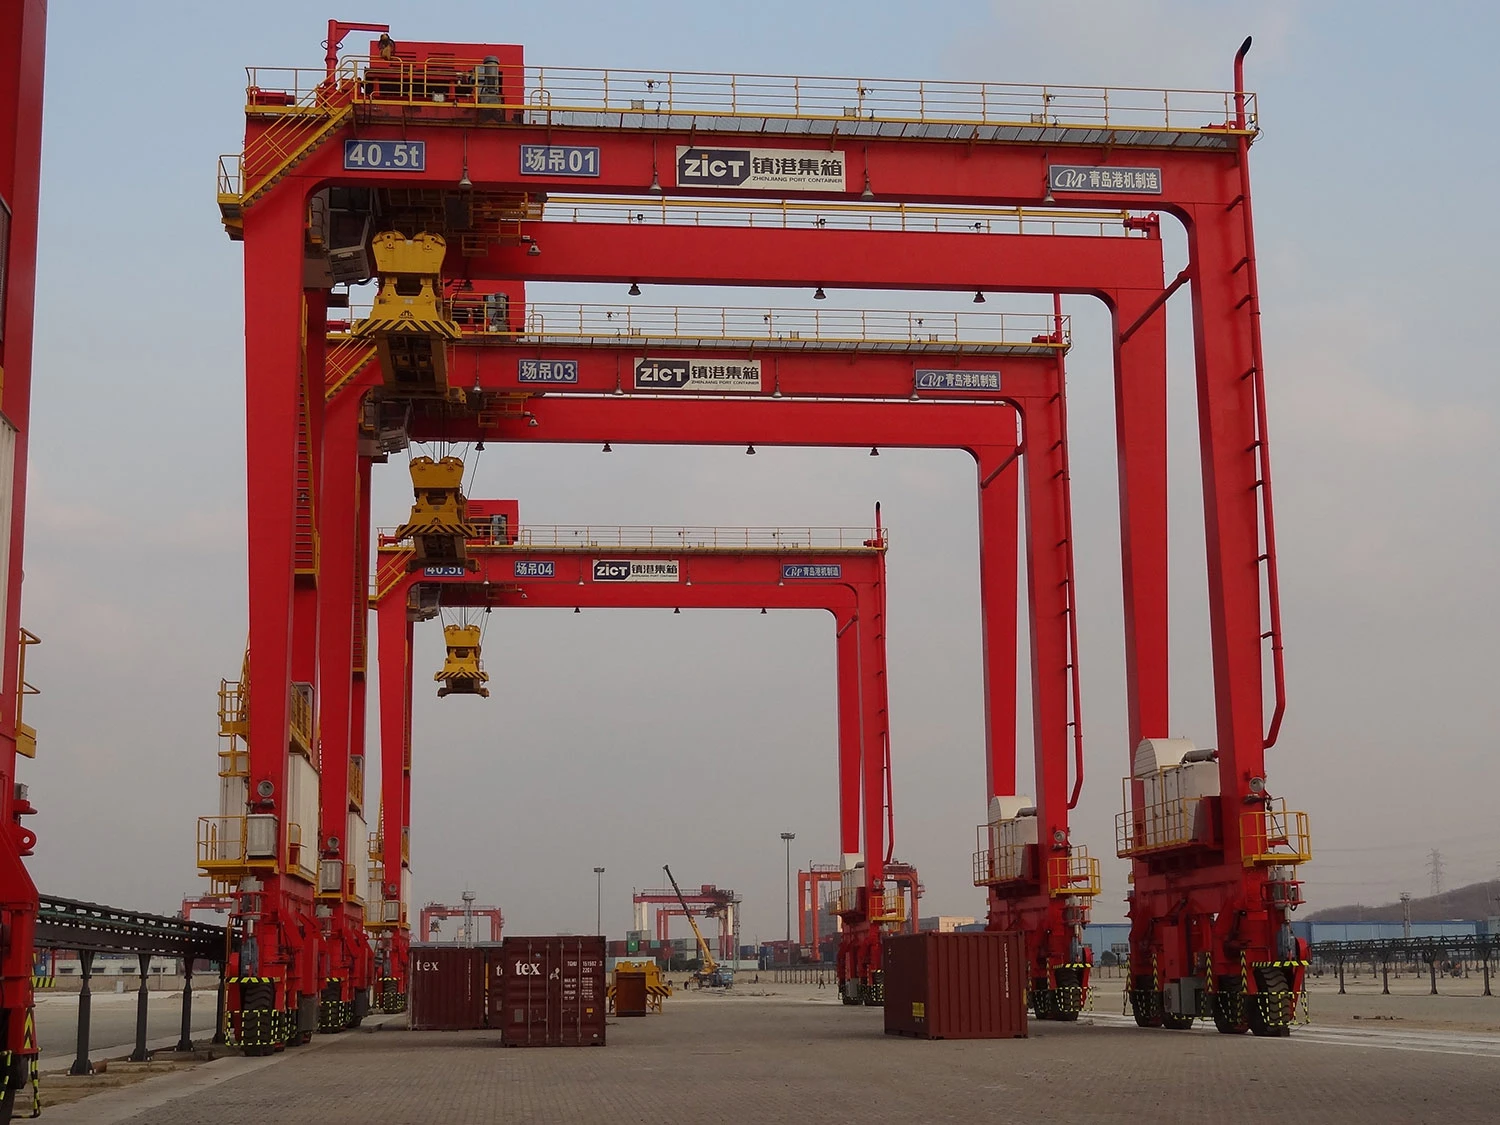
Crane Moves Per Hour (CMPH)
Crane moves per hour is a main number for ports. It shows how many containers or cargo units your portal crane or container crane moves in one hour. This KPI affects how fast you move goods and how quickly ships leave the port.
|
Metric |
Value/Description |
|---|---|
|
Optimal CMPH for performance |
|
|
Lower CMPH range |
20-25 (indicates room for improvement) |
|
Impact of CMPH on throughput |
1 additional move per hour increases throughput by 7,387.606 TEU |
You want CMPH to be above 30 for best results. Higher CMPH means ships leave faster and cargo moves quickly. If CMPH is low, you might have delays and lose money. CEGC’s anti-sway control and motion systems help you get better CMPH by making loads steady and cycles faster. You can change your portal crane or container crane to fit your speed and automation needs.
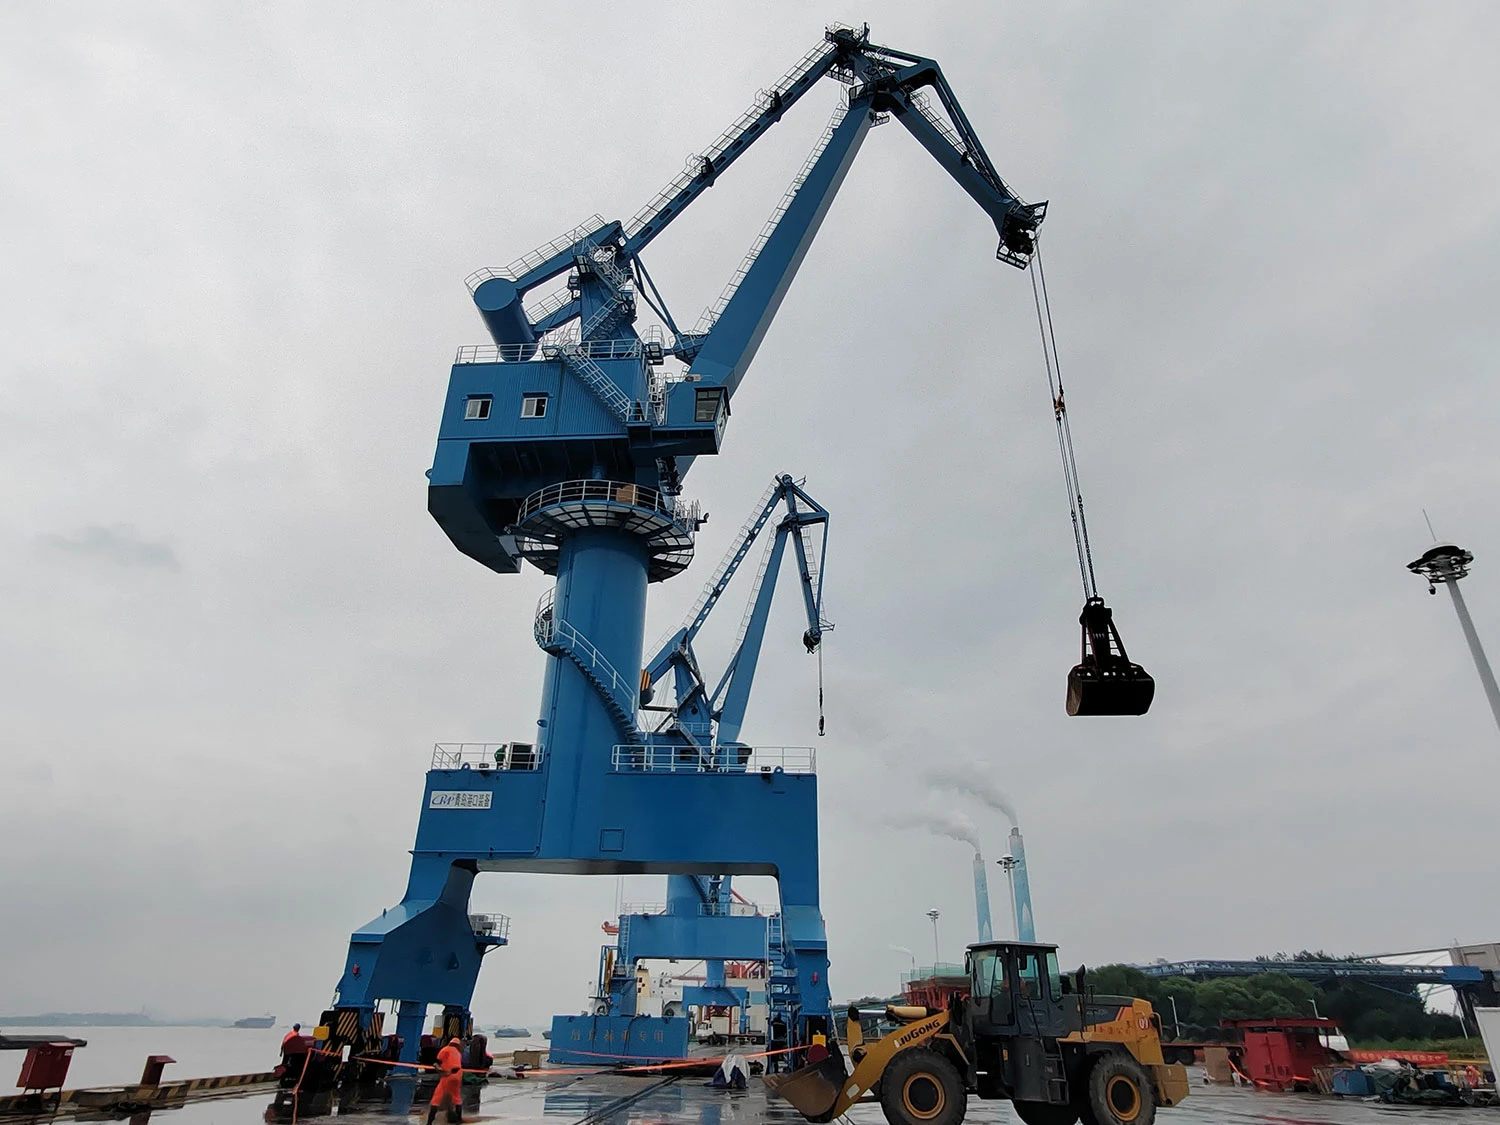
Cargo Throughput KPI
Cargo throughput tells you how much cargo your port handles in a certain time. This KPI is important because it shows your port’s size and how much it can do.
|
Terminal Type |
Benchmark (TEU) |
Additional Metrics |
|---|---|---|
|
Container Terminals |
Varies by size |
|
|
|
|
2,796 tonnes/berth meter |
High cargo throughput means you move more goods and make more money. If throughput is low, you get traffic jams and spend more. CEGC’s equipment helps you move cargo fast with smooth workflows. You can pick standard specs or ask for custom solutions for your port.
Crane Productivity KPI
Crane productivity shows how well your cranes work during operations. This includes crane moves per hour and how much time cranes spend at the berth.
-
Good ports want crane moves per hour above 30.
-
The best berth occupancy rate is between 70% and 85%.
You can make cranes work better with anti-sway systems and real-time data. CEGC’s cranes have these tools to help you keep high productivity and make operators less tired. You can also choose how much automation and safety you want.
Vessel Turnaround Time KPI
Vessel turnaround time is how long a ship stays at your port. This KPI matters because it affects how many ships you can handle and how happy your customers are.
Shorter vessel turnaround times let you work with more ships and move more cargo. Delays cause traffic and missed chances. By watching this KPI and using CEGC’s tech, you can load and unload faster and use your yard better.
Truck Turn Time KPI
Truck turn time is how long trucks spend in your terminal. This includes waiting in line and doing business at the port.
-
Big terminals want truck turn times of 30–45 minutes.
Truck turn time affects how busy your port is and if customers are happy. Long waits cost more and can be unsafe. CEGC’s cranes and yard machines help trucks move in and out fast and safely. You can watch this KPI to find problems and fix them.
Container Dwell Time KPI
Container dwell time is how long containers stay in your yard before leaving. This KPI is important for using your yard space well.
-
Good ports keep dwell time under four to five days.
-
If dwell time is over seven days, there may be planning or customs problems.
Shorter dwell time helps you move more cargo and avoid crowding. You can use data and maintenance plans to spot slowdowns. CEGC’s container handler and reach stacker forklifts help you move containers quickly and safely.
Safety Standards KPI
Safety standards KPI tracks accidents, close calls, and if you follow safety rules. This KPI keeps people, machines, and cargo safe.
CEGC’s anti-sway systems and safety controls lower the risk of accidents and mistakes. You can pick safety features and sensors for your portal crane or ship crane. Watching this KPI helps you meet rules and keep everyone safe.
Real-Time Productivity Tracking KPI
Real-time productivity tracking uses data from AI, IoT sensors, and terminal systems to check crane use, yard space, and other KPIs.
|
Technology Type |
Description |
|---|---|
|
AI |
Uses operational KPIs to predict demand and congestion. |
|
IoT Sensors |
Collects data from cranes and yard equipment for a full view of port activities. |
|
Video Analytics |
Turns CCTV footage into operational data for pattern detection. |
|
Terminal Operating System |
Centralizes operations and integrates KPI alerts for automated decision-making. |
Real-time tracking helps you find problems early and plan repairs before things break. CEGC’s cranes let you check their condition and fix issues from far away. This keeps your port running well and gives you data to keep getting better.
Tip: Use dashboards and automatic reports to show these KPIs to your owner and team. Clear charts and graphs help everyone see how things are going and make smart choices.
By using these port crane: path planning kpis to show owners, you can make your port better, work faster, and stay ahead of others. CEGC gives you standard specs and custom options for all your port and harbor needs.
Why port operations KPIs matter for owners
Operational Efficiency and ROI
Port operations KPIs help you work better and earn more money. When you check each key performance indicator, you see how your port is doing. You can find slow spots in container terminal operations. You also find ways to make vessel turnaround time faster. Data from these KPIs helps you plan for more cargo and better yard use. You make smart choices that help your port improve and get more work done. Owners use these numbers to make things better and keep port crane: path planning kpis to show owners useful.
Reliability and Safety Impact
You want your port to be safe and work well every day. KPIs show you where there might be risks, like load sway or crashes. You use data to see if cranes are ready to use and stop downtime. Safety KPIs help you follow rules and keep workers safe. CEGC’s cranes have special controls that lower accidents and keep things running. You check how cranes do to make sure they meet high standards.
Maintenance and Lifecycle Cost KPI
You keep maintenance and costs low by watching KPIs. You track how long it takes to fix things when they break. You want to spend less on repairs and keep cranes working. You organize spare parts and plan repairs to save money and keep things running. Data helps you fix problems before they get big. You use KPIs to see how you are doing and get better over time.
-
Total maintenance cost per crane
-
Spare parts management efficiency
Decision-Making Support KPI
Port operations KPIs help you make good choices. Data from your port shows you how things are going. You can compare numbers from different places and plan upgrades. KPIs help you pick the right tools for your port. You use data to make your port better and stay ahead.
Note: Watching KPIs gives you helpful data for planning, checking, and always getting better in port and harbor operations.
Presenting and tracking key performance indicators
Dashboard and Reporting Tips
You need easy-to-read dashboards to show port crane: path planning kpis to show owners. Update your data every month so it stays fresh. Use short names for each key performance indicator so everyone gets them. Make sure all units are the same on your dashboard. Put kpis into groups by department to make things clear. Teach your team how to read and use the dashboard. If you see a missed metric, fix it right away. Use red arrows or icons to point out problems. Check your targets every year to match changes in port and harbor operations.
Tip: Look at trends often. This helps you know why performance goes up or down and helps you plan better.
Benchmarking for Port Crane KPIs
You can check your port’s operational kpis against industry standards to find ways to get better. Use tables to track how your portal crane, container crane, or container handling gantry crane works. Benchmarking helps you reach top crane availability and yard use.
|
Category |
Description |
|---|---|
|
Asset |
Focus on equipment and infrastructure optimization. |
|
Operations |
Improve daily container terminal operations. |
|
Technology |
Use new tools for better performance and productivity. |
|
Organization |
Support better management and yard utilization. |
You should compare your numbers with the best ports. This shows where you can improve crane availability and container terminal operations.
Actionable Insights for Owners
Tracking kpis gives you strong ideas for port and harbor operations. Automated kpi tracking figures out cycle times, idle times, and travel distances. Signal monitoring checks crane positions, spreader size, and faults. Event-based data collection marks each crane cycle for correct results. Advanced data processing turns raw data into useful metrics for making things better. You can keep all data in one main database. This makes it easy to compare performance and yard use at different ports. Real-time productivity tracking helps you find problems early and plan maintenance before things break.
Note: Use these ideas to keep getting better in port and harbor operations and keep your crane availability high.
You can make your port better by watching each key performance indicator. These KPIs help you plan, stay safe, and work smarter. CEGC gives owners strong choices and custom options that meet industry rules. See the list of services below:
|
Service Type |
Description |
|---|---|
|
Customized Equipment Manufacturing |
Special solutions for your project’s needs. |
|
Service Consulting |
Expert help to make your port work better. |
|
Jobsite Assembly |
Setting up and testing equipment at your port. |
|
Training Programs |
Teaching people how to use equipment safely. |
|
Spare Parts Availability |
Quick delivery of good parts when you need them. |
Use these KPIs to help you make choices and keep your port running well.
FAQ
What is gross crane moves per hour?
Gross crane moves per hour tells you how many containers cranes move in one hour. This number helps you see if your port is working well.
How does berth utilization rate affect port performance?
When berth utilization rate goes up, port performance gets better. High rates show you use berths well and ships wait less time.
Why should you track container terminal productivity?
You track container terminal productivity to find slow places and make cargo move faster. This helps you plan upgrades and make your port do more work.


