You measure Port crane: weather uptime KPIs you can report by checking how often the crane is working. You also look for reasons it stops, like weather or safety holds. CEGC gives you smart tools to help with these problems. Tracking KPIs the right way helps you keep clients, improve service, make your reputation better, and build trust in billing, as shown below:
|
Benefit |
Description |
|---|---|
|
Happy clients come back for more vessel calls or cargo handling |
|
|
Guides service improvement |
Feedback shows where work or talking can get better |
|
Boosts reputation |
High CSI gives you an edge over other terminals |
|
Enhances billing trust |
Clear and correct billing makes people believe and stay loyal |
Key Takeaways
-
Watching port crane uptime KPIs helps keep clients happy. Good service makes clients come back again.
-
Weather like wind and rain can change how cranes work. Knowing this helps plan better and stay safe.
-
Using smart tools and live data can help cranes work well in bad weather. This makes things safer and cuts down on waiting time.
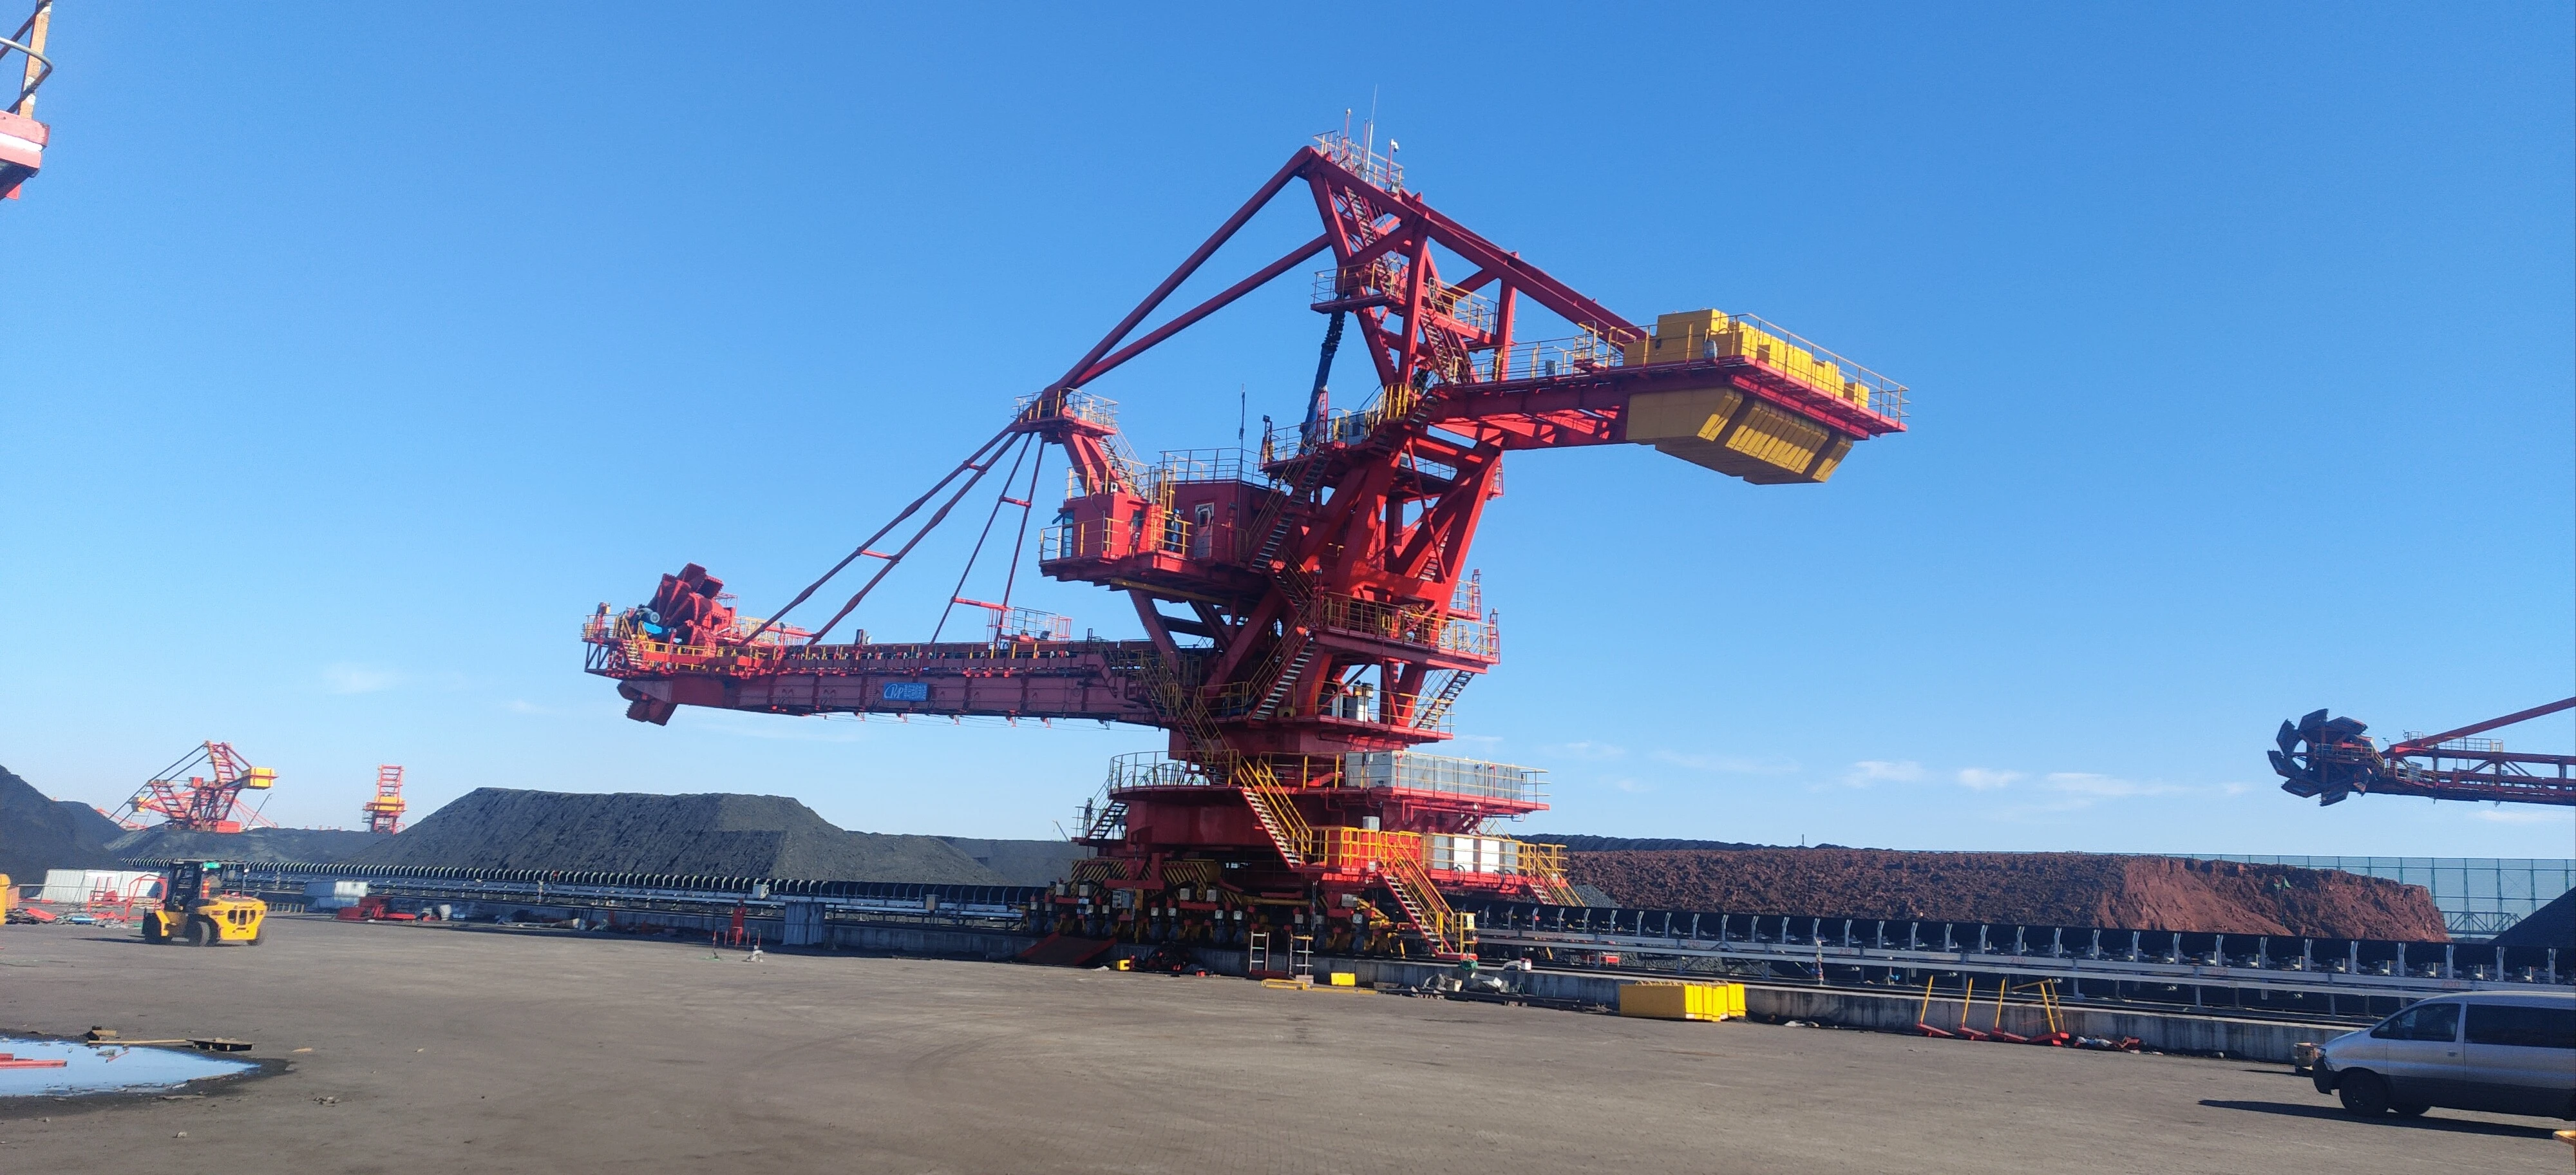
Uptime KPIs & impact of weather on crane operations
What are port crane uptime KPIs?
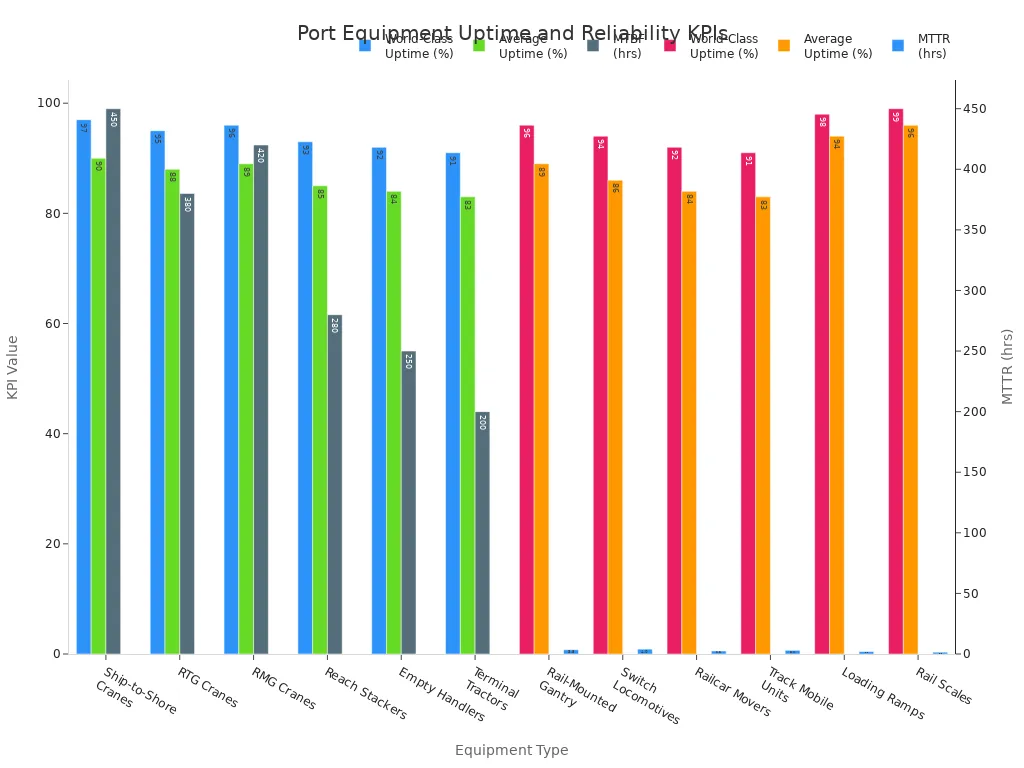
You can see how well your crane works by checking uptime KPIs. These KPIs tell you how often your portal crane, container crane, or ship crane is working without stopping. Some common KPIs are uptime percentage, mean time between failures (MTBF), and mean time to repair (MTTR). If your uptime is high, your cranes work well and you do not lose time or money. Here is a table that shows world-class and average uptime for different container handling equipment:
|
Equipment Type |
World-Class Uptime |
Average Uptime |
MTBF (hrs) |
|---|---|---|---|
|
Ship-to-Shore Cranes |
97% |
90% |
450 |
|
RTG Cranes |
95% |
88% |
380 |
|
RMG Cranes |
96% |
89% |
420 |
|
Reach Stackers |
93% |
85% |
280 |
|
Empty Handlers |
92% |
84% |
250 |
|
Terminal Tractors |
91% |
83% |
200 |
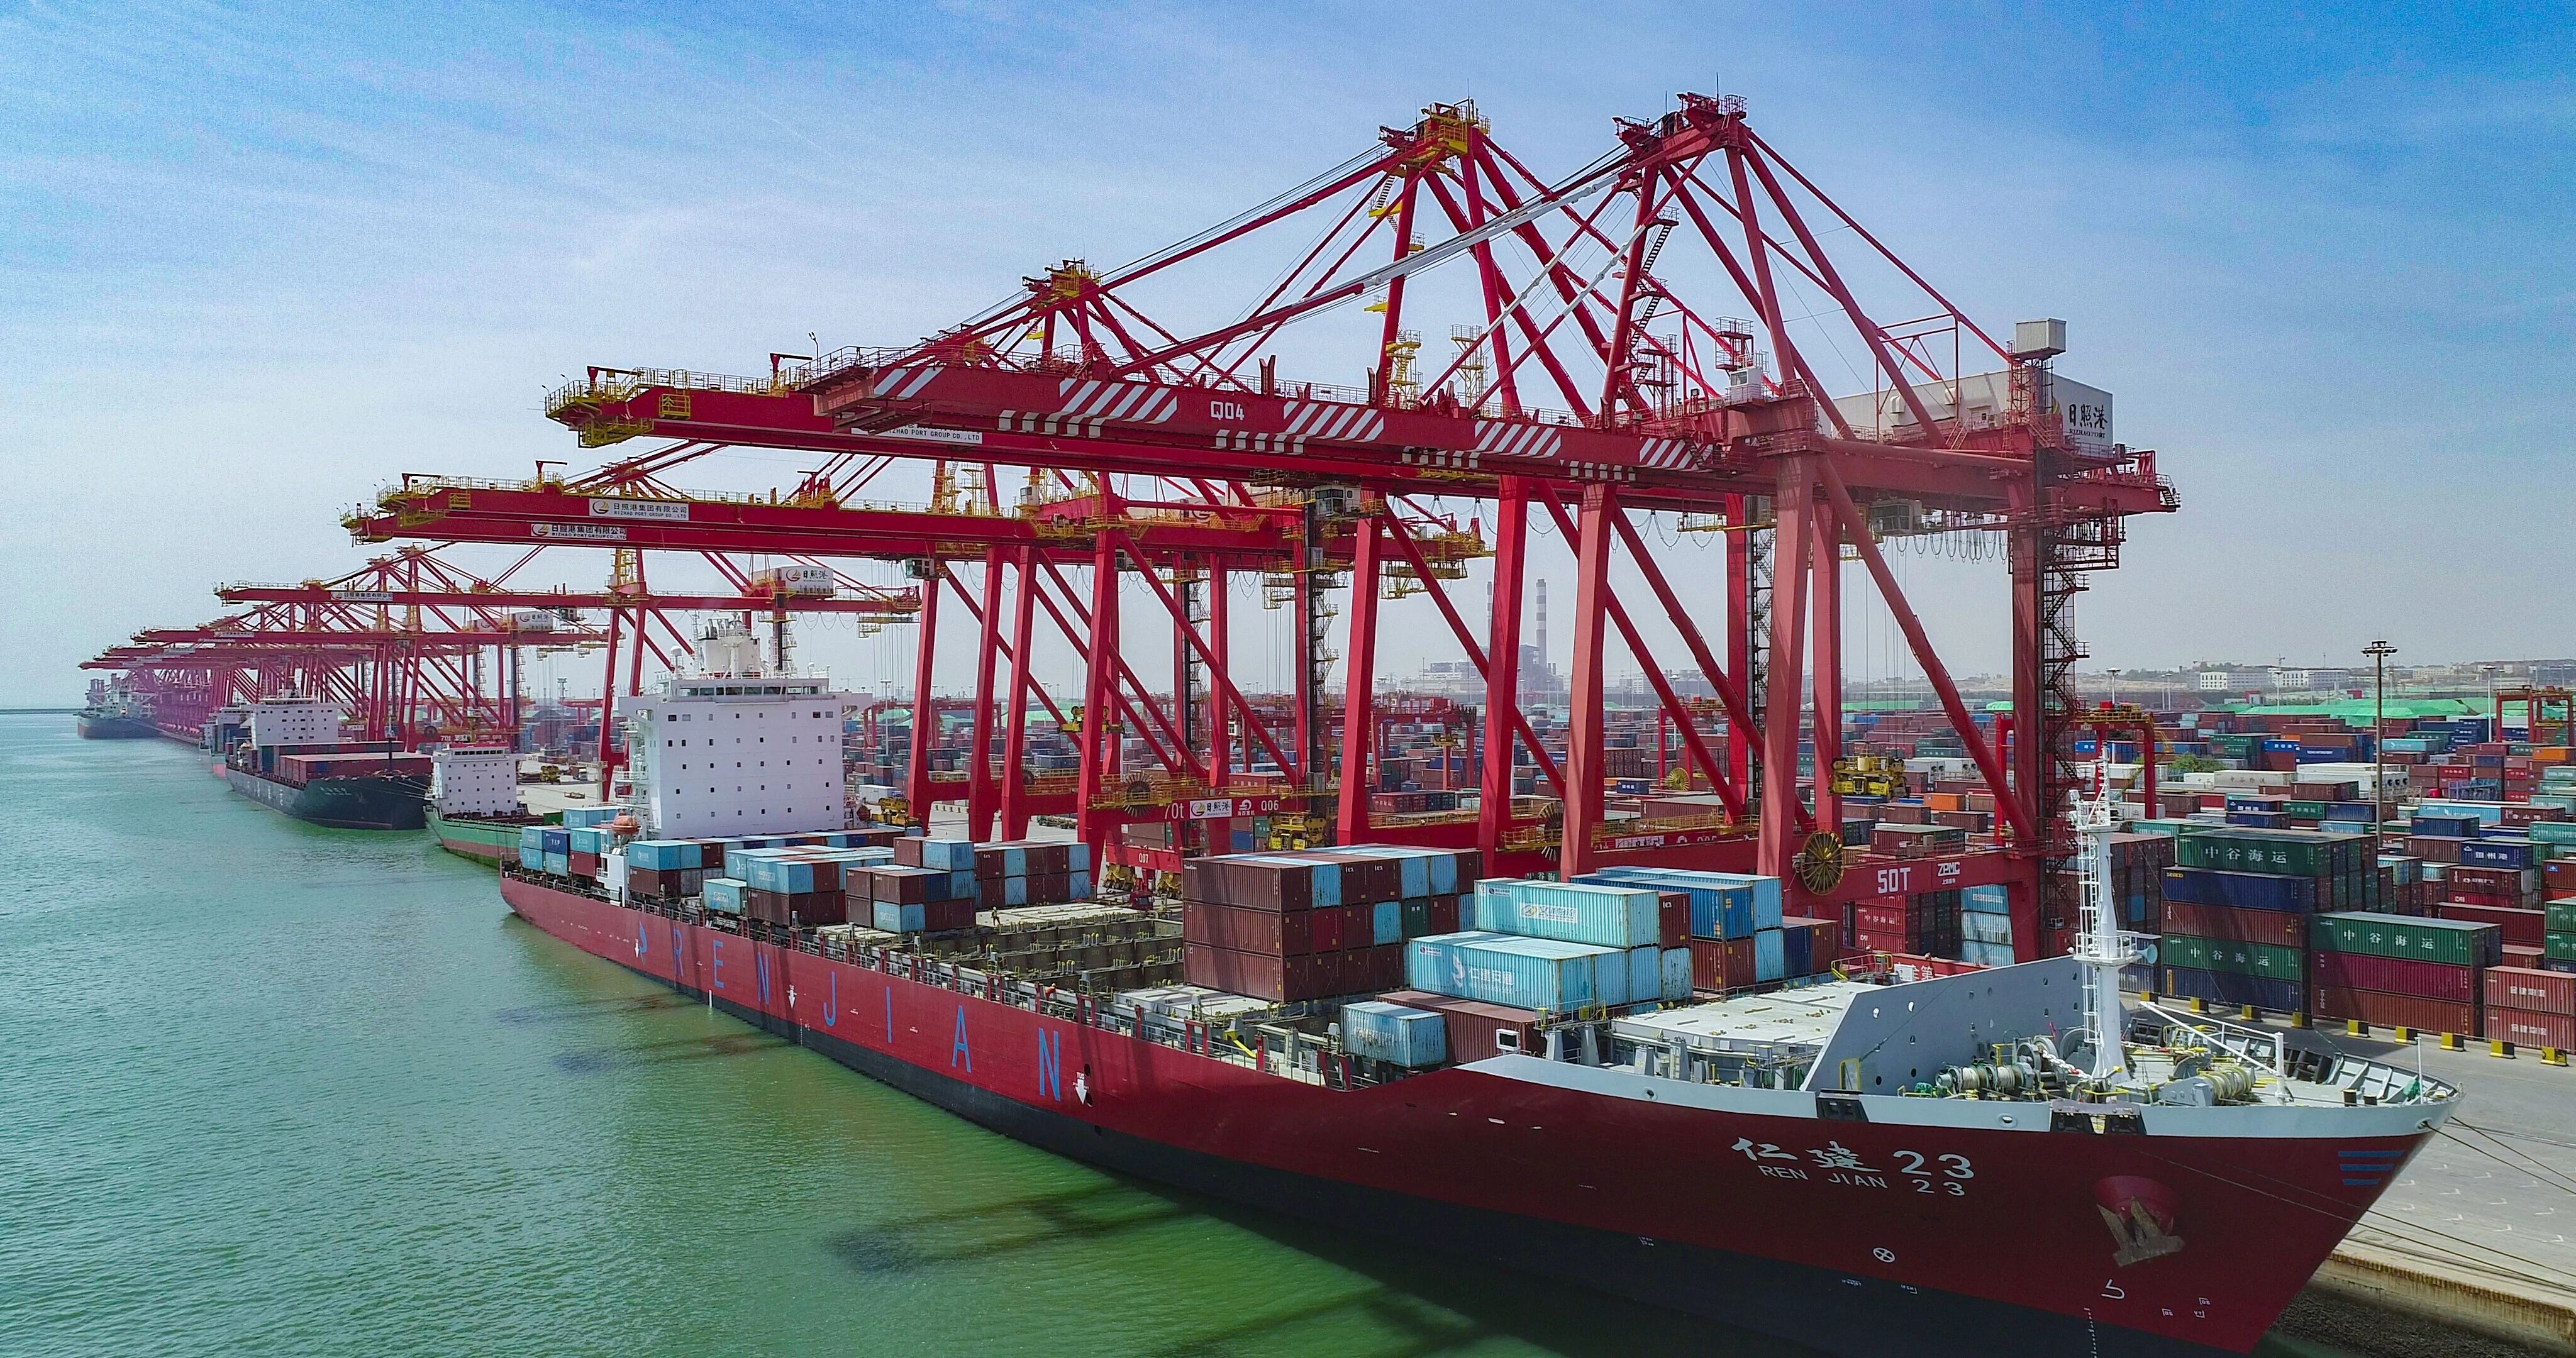
Weather conditions affecting port crane operations
Weather like wind, rain, cold, and storms can stop cranes or make them unsafe. Wind can make loads swing and you may need to stop work. Rain can hurt electrical parts and make it hard to see. Cold weather slows down hydraulic systems and can freeze cables. Salt air makes metal rust faster, so you need more repairs. Lightning can break systems and stop cranes from working. Here is a table that shows how weather can affect crane operations:
|
Weather Condition |
Impact on Crane Operations |
|---|---|
|
Wind |
Causes load instability, halts operations at 25-30 mph, risk of tipping or dropped cargo. |
|
Rain |
Can corrode electrical components, reduce visibility, and require more frequent maintenance. |
|
Cold Weather |
Slows hydraulic systems, increases risk of ice on cables, and may necessitate pausing operations. |
|
Salt Air |
Accelerates corrosion, leading to increased maintenance costs and potential failures. |
|
Lightning |
Can damage electrical systems and pose safety risks, necessitating operation suspension during storms. |
Why track weather-related downtime?
You should keep track of downtime from weather to keep cranes safe and working well. Weather downtime costs the shipping industry a lot of money every year. If you know when and why cranes stop, you can plan better and lower risks. CEGC’s anti-sway systems, safety interlocks, and marine durability features help cranes work even in bad weather. These tools cut down on load sway, stop accidents, and protect your equipment from rust. By tracking downtime and using CEGC’s technology, you make things safer, save money, and keep your port running.
Measuring & reporting port crane: weather uptime KPIs you can report
Tools for monitoring crane operations in weather conditions
You need special tools to track port crane: weather uptime KPIs you can report. This is important when weather changes fast. Modern dashboards show important numbers like uptime, idle time, and slow spots. These dashboards help you find problems early. They keep cranes working during storms or strong winds.
To check crane performance in tough weather, you should use:
-
Anemometers measure wind speed. They warn you when winds are too strong for safe lifting.
-
Condition monitoring sensors track how your portal crane, container crane, or ship crane works. These sensors help stop breakdowns and improve uptime.
-
Antisway controllers work with anemometers. They help cranes adjust to wind gusts and stop if storms get too strong.
-
Weather monitoring systems, like Vaisala AWS430, give nonstop updates about the environment. They collect real-time data and show it in a simple way.
-
Predictive maintenance tools use AI to spot strange patterns. These tools help you plan maintenance before something breaks, even in rain or storms.
You can also use advanced tools like WindCube Scan. It uses lasers to track 3D wind data. AI-based dwell-time prediction tools help manage waiting times and reduce congestion. Risk assessment models help you plan for bad weather by looking at past failures and recovery times.
Tip: Always check weather forecasts and keep backup resources ready. Schedule maintenance to avoid problems during storms or rain.
Data sources & real-time weather integration
You need good data to measure port crane: weather uptime KPIs you can report. The best way is to mix crane operation data with live weather information. Use dashboards that show throughput and current weather. These dashboards display temperature, forecast, and visual cues. This helps you make choices about docking, cargo handling, and safety during storms.
Reliable data sources include:
-
Local maritime observation systems track wind direction, speed, and visibility. These systems help you react fast to changing weather.
-
Integrated dashboards group data by origin, like traffic, vessel info, and weather. This makes it easy to see how weather affects your KPIs.
-
Real-time panels separate data points like temperature, wind speed, and precipitation. This helps you see how storms or high winds impact your port crane: weather uptime KPIs you can report.
When you connect these data sources, you see how storms, high winds, and rain affect your cranes. This helps you build weather resilience and plan for improvement.
Reporting methods for port stakeholders
You must share port crane: weather uptime KPIs you can report with port authorities, terminal operators, and other stakeholders. Use advanced dashboards and analytics to show crane productivity, berth occupancy, and downtime from storms or bad weather.
Recommended reporting methods include:
-
Customizable reports and visualizations highlight trends and forecast demand.
-
Maintenance KPI Reporting Services show uptime, MTBF, and MTTR. These reports are clear, accurate, and timely.
-
Real-time visibility tools keep everyone updated about weather-related KPIs.
-
Automated messaging systems send alerts during storms or high winds.
-
Collaborative platforms let you share status updates and align priorities, especially when weather changes quickly.
Note: Good communication helps everyone respond faster to storms and bad weather. It also improves safety and efficiency.
CEGC offers customizable solutions for monitoring, reporting, and improving port crane: weather uptime KPIs you can report. You can adjust these systems for your container handling equipment, container gantry crane, or reach stacker forklift. With CEGC, you get the right data, tools, and support to handle storms, high winds, and other tough conditions.
You can check port turnaround time by looking at how equipment is used, how long things wait, and how well work gets done. CEGC’s tools help stop delays and keep everyone safe. If you track KPIs often, you can make port turnaround time better, stop delays, and improve how fast things move. Pay attention to port turnaround time to get better results.
|
Description |
|
|---|---|
|
Throughput |
Shows how many TEUs are handled. This tells you the terminal’s capacity. |
|
Turnover Time |
Measures how long ships, trucks, and trains take at the port. |
|
Equipment Utilisation |
Tracks port turnaround time by showing how many moves happen each hour. |
|
Dwell Time |
Shows how long containers stay in the yard. This affects port turnaround time. |
|
Service Reliability |
Helps stop delays and supports better port turnaround time. |
FAQ
How does wind affect port crane operations?
You need to pay attention to wind at your port. If the wind is strong, cranes might have to stop. Strong wind makes it harder for people and machines to work safely. It also slows down how well the port works.
Why is corrosion a problem for port equipment?
Corrosion hurts metal parts at the port. Salt in the air and wet weather make corrosion happen faster. You should check for corrosion a lot. This helps your port work better and stay strong.
How do you improve port performance during bad weather conditions?
You use live data to see how the port is doing. You watch for wind, rain, and other weather. You get ready for times when work must stop. This helps your port stay safe and keep working even in bad weather.
-
Tip: Always look at wind speed and weather before you start work at the port. This helps your port work well and keeps people safe.
|
Factor |
Impact on Port Performance |
|---|---|
|
Wind |
Stops cranes, lowers safety |
|
Corrosion |
Damages equipment, raises cost |
|
Conditions |
Affect schedules, slow work |


