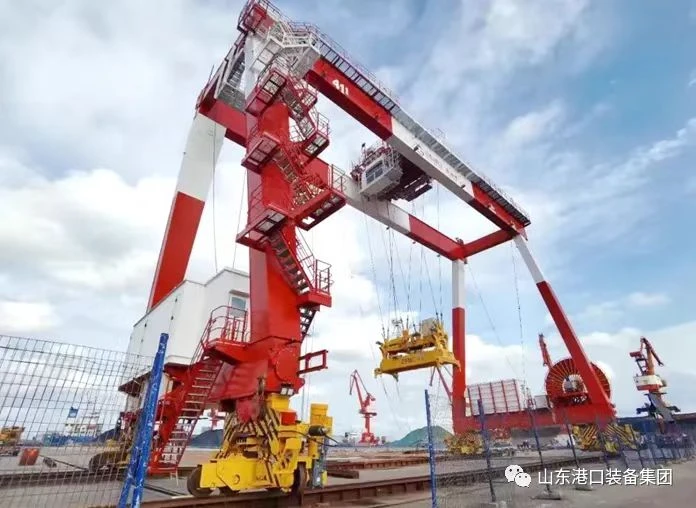
To ensure safe and efficient container handling equipment dispatch, you need the right key performance indicators. CEGC’s advanced port machinery is designed to help you achieve your operational goals, with a strong focus on safety, automation, utilization, and accuracy. The Container handling equipment dispatch: KPI dashboard provides real-time information, enabling you to optimize performance, save time, and consistently meet industry efficiency standards.
Key Takeaways
-
Watch important KPIs like Equipment Utilization Rate and Turnaround Time. This helps make work faster and cuts down on waiting in container handling. - Use automation and real-time data to make Dispatch Accuracy better. This makes sure the right equipment goes to the right job. It also keeps people safe and stops mistakes. - Check your KPIs often and match them with business goals. This keeps your container handling work fast, saves money, and helps customers.
Essential KPIs for Container Handling Equipment Dispatch
You need to watch the right KPIs to make your container handling equipment dispatch better. These KPIs help you see how well things work, find problems, and make your port run smoother. The table below shows the most important logistics kpi definitions for your dispatch process:
|
KPI |
Definition |
|---|---|
|
Equipment Utilization Rate |
Percentage of time your equipment operates versus available time. |
|
Total time from arrival to departure for vessels, trucks, or containers. |
|
|
Dispatch Accuracy |
Percentage of correct dispatches versus total dispatches. |
|
Maintenance Downtime |
Time equipment is unavailable due to maintenance. |
|
Cost Per Move |
Average cost to move a container from one point to another. |
|
Load Acceptance Rate |
Percentage of loads accepted versus total loads offered. |
|
Average time a container stays in the yard. |
|
|
Quay Crane Productivity |
Number of container moves per hour by quay cranes. |
Equipment Utilization KPI
You want your portal crane, container handler, or reach stacker to work as much as possible. This kpi shows how much time your machines are busy. High utilization means you use your machines well. Low utilization means they sit unused or are not scheduled right.
-
Automation kpis help you cut down on wasted time and energy. Automation lets you plan equipment use better.
-
Predictive maintenance and remote checks keep machines working longer. This makes them last and helps the environment.
-
Top terminals have an average equipment utilization rate of 68%. The best aim for 80% or more.
-
You should check both capacity utilization and equipment utilization rate. This helps you balance work and not overuse machines.
Watching this kpi on your container handling equipment dispatch: kpi dashboard helps you find slow spots and get better.
Turnaround Time KPI
Turnaround time is a key performance indicator that tells you how long it takes for a vessel, truck, or container to finish its trip in your terminal. You want to make turnaround time shorter to move more cargo and make customers happy.
-
This kpi includes all waiting and working times. It helps you find and fix slowdowns.
-
Faster turnaround gives you more space and keeps schedules on track.
-
By looking at turnaround time, you can make cycle time and performance better.
-
Automation kpis and linking your container gantry crane or ship loader can speed up work.
You should use this kpi to work faster and keep your port strong.
Dispatch Accuracy KPI
Dispatch accuracy shows how often you send the right equipment to the right job at the right time. High accuracy means fewer mistakes, less fixing, and safer work.
-
You can use order accuracy rate to help measure this.
-
Automation and real-time data help you match automation kpis and lower mistakes.
-
Safety kpis like dispatch accuracy keep your team and cargo safe.
-
Good dispatching helps you work the same way every time.
You should watch this kpi to make sure your logistics kpi dashboard gives you useful information.
Maintenance Downtime KPI
Maintenance downtime is the logistics kpi that shows how long your equipment is out for repairs or checks. You want to keep downtime low so your work does not stop.
-
Seeing maintenance numbers in real time helps you find problems.
-
Automated alerts and predictive maintenance cut down on surprise breakdowns.
-
Bad maintenance can lower your work by up to 20%. Preventive plans save money and stop problems.
-
CEGC’s port machines let you check from far away and fix things faster.
You should use this kpi to make your machines more reliable and save money in your container handling equipment dispatch: kpi dashboard.
Cost Per Move KPI
Cost per move is a key performance indicator that tells you the average cost to move a container. You want to make this cost lower to earn more and work better.
-
This kpi counts labor, energy, and maintenance costs.
-
Automation kpis and energy-saving tools in your cargo crane or reach stacker forklift can lower costs.
-
Watching cost per move helps you find ways to save and decide if you need new tech.
You should track this kpi to see how well your logistics work with money.
Load Acceptance Rate KPI
Load acceptance rate shows how many loads your terminal takes compared to all loads offered. High acceptance means you use your space well and help more customers.
-
This kpi shows if you can meet demand with what you have.
-
Using capacity and automation helps you take more loads.
-
You can use this number to plan for busy times and stop crowding.
You should add this kpi to your dashboard to help your terminal grow and stay green.
Dwell Time KPI
Dwell time is the average time a container stays in your yard. You want dwell time to be short to stop crowding and make planning easier.
-
High dwell times fill up storage and slow down cranes.
-
Watching dwell time helps you handle backlogs and stop slowdowns.
-
Lower dwell time saves money for carriers and shippers.
-
Automation kpis and smart stacking in your container handling gantry crane help you move containers better.
You should use this kpi to work faster and keep your terminal running well.
Quay Crane Productivity KPI
Quay crane productivity shows how many container moves your quay cranes do each hour. This kpi helps you move more cargo and work better.
|
Strategy |
Impact on Productivity |
|---|---|
|
Real-time tracking helps you make quick choices. |
|
|
Continuous skill development |
Fewer mistakes and more flexibility. |
|
Predictive maintenance |
Less downtime and smoother work. |
|
Automation |
More steady handling rates. |
|
Smart stacking/layout changes |
More crane time and fewer reshuffles. |
|
Integrated systems/coordination |
Smoother flows and less crowding. |
-
The best terminals watch both gross moves per hour and net moves per hour.
-
Automation kpis and real-time checks help you get more done.
-
CEGC’s container crane and ship crane tools help you move lots of cargo with smart automation and safety.
You should focus on this kpi to do your best and meet industry goals.
Tip: Check your operational kpis and logistics kpi dashboard often to make sure you reach your goals for safety, speed, and being green.
Selecting and Visualizing Logistics KPIs
Aligning KPIs with Business Goals
Pick logistics kpi metrics that match what you want to achieve. Delivering on time keeps customers happy. Good product quality builds your reputation. Managing costs makes your port strong. Use kpis that fit your plan and keep using them. Check your kpi scorecards every month. Look at business results every quarter. Ask teams from different areas how kpis affect their work.
|
Description |
|
|---|---|
|
Consistency |
Pick kpis that match your goals and keep using them. |
|
Regular Review |
Check performance every month and quarter. |
|
Cross-Functional Involvement |
Ask all teams how kpis change their work. |
Process Mapping for KPI Selection
Draw your container handling equipment dispatch process step by step. Find where automation, safety, and utilization matter most. Look for places to improve order accuracy rate, equipment utilization rate, and capacity utilization. Use kpis to measure each stage. This helps you find slow spots and make things better. Match automation kpis with your workflow for better results.
Benchmarking and Continuous Review
Compare your logistics kpi metrics to industry standards. Use frameworks like BIMCO Shipping KPI System to work better. RightShip’s GHG Rating checks safety and how green you are. ISO 19030 measures fuel use. EEOI tracks carbon emissions for each cargo. Shipdex Standard helps with maintenance data. Class Societies give custom kpis for your fleet. Check your kpis often to find gaps and improve performance.
|
Framework/Standard |
Focus Area |
Description |
|---|---|---|
|
BIMCO Shipping KPI System |
Operational Efficiency |
Tracks kpis for steady improvements. |
|
RightShip's GHG Rating |
Sustainability |
Checks carbon efficiency and safety rules. |
|
ISO 19030 |
Fuel Efficiency |
Watches hull and propeller performance. |
|
EEOI |
Sustainability |
Measures fuel use and emissions per cargo. |
|
Shipdex Standard |
Technical Data |
Helps with maintenance and buying parts. |
|
Class Societies Custom KPIs |
Utilisation |
Custom kpis for checking conditions. |
KPI Dashboard Design Best Practices
Make your dashboard clear with specific kpis. Make sure metrics are easy to measure and reach. Set targets that are realistic for performance and efficiency. Pick metrics that show progress in real time. Do not use too many kpis or it gets confusing. Use a hierarchy to focus on the most important indicators. Clean and combine data for accuracy. Real-time data gives you quick insights and helps with predictive maintenance. This makes operational kpis better and helps you decide fast. Change your dashboard to fit CEGC’s port machinery and automation solutions.
Tip: Use real-time reporting to find gaps and track progress. This keeps your container handling equipment dispatch: kpi dashboard useful and supports being green.
You get better container handling equipment dispatch: kpi dashboard results by picking the right kpi. Automation and real-time metrics help you work faster and safer. A special dashboard keeps track of time, safety, order accuracy rate, and yard utilisation rate. The table below shows how kpis and automation kpis make your port work better, faster, and greener.
|
Metrics |
Improvements |
|---|---|
|
kpi, logistics kpi |
Better performance |
|
automation, real-time |
Faster delivery time |
|
capacity utilization |
Higher utilisation |
|
safety, total recordable incident rate |
Safer operations |
|
operational kpis, logistics metrics |
More accuracy and control |
Checking kpis often and updating your dashboard helps you hit your goals every time.
FAQ
What is a kpi dashboard for container handling equipment dispatch?
A kpi dashboard helps you watch important numbers. You can see equipment use, logistics kpi, and automation. This lets you make your work better. It also helps you choose what to do next.
How does automation improve kpi results?
Automation helps you work faster and safer. Automation kpis tell you how your systems are doing. You can find problems quickly. This helps you fix things and do better.
Why should you review logistics kpi and kpi data often?
Checking logistics kpi and kpi data often helps you find problems. You can make your process better by looking at the data. This keeps your automation and performance strong.


