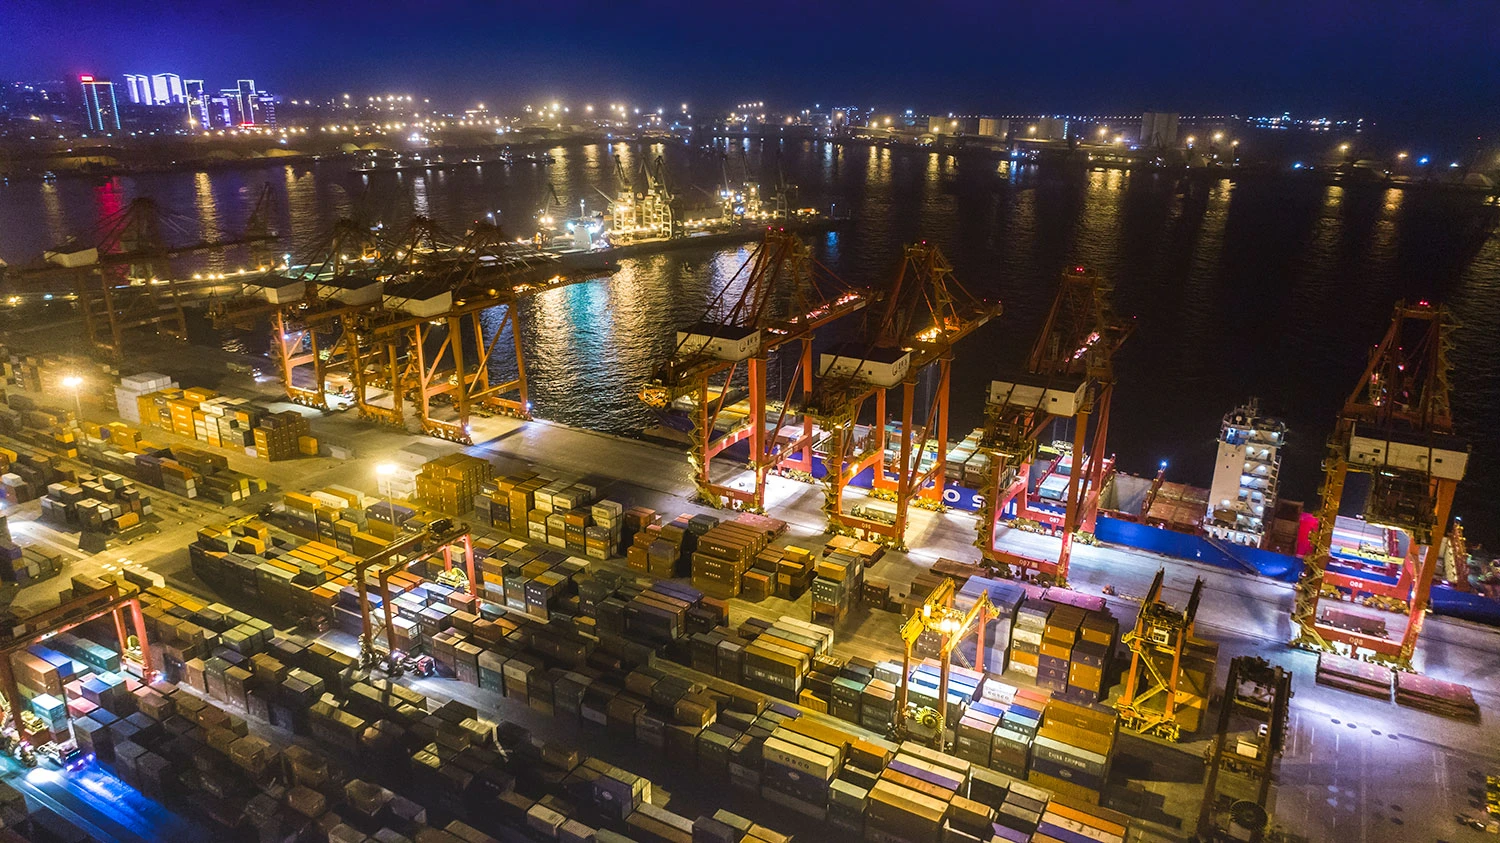
You want to make the port safer and faster. A container gantry crane: hoist speed KPI template lets you check crane moves each hour and berth occupancy rate. This template solves main problems in your work. With CEGC, you get top lifting equipment solutions that you can change to fit your needs for better performance you can measure.
Key Takeaways
-
Use a hoist speed KPI template to watch crane work. This helps make port jobs faster and better.
-
Check hoist speed data every day to find problems early. Checking often makes things run smoother and saves time.
-
Change your KPI template to match your port’s needs. Adding special boxes can help track data and make better choices.
Defining hoist speed KPIs in port operations
What is hoist speed for container gantry cranes
Hoist speed means how fast a crane lifts or lowers a container. This speed is very important in every port job. People measure hoist speed in meters per minute. The table below shows the usual speeds for container gantry cranes:
|
Trolley Traverse Speed (m/min) |
Gantry Travel Speed (m/min) |
|
|---|---|---|
|
50-180 |
180-240 |
30-45 |
Some cranes, like rubber-tired gantry cranes, lift containers at 12 to 46 meters per minute. Other cranes can go as slow as 3.3 meters per minute.
Why hoist speed matters for port efficiency
Hoist speed changes how fast you move containers on and off ships. If hoist speed is faster, you can do more crane moves each hour. This means you get more work done and ships leave sooner. The table below shows how hoist speed helps port work:
|
Productivity Target |
Impact on Throughput and Turnaround Time |
|---|---|
|
Minimize dwell |
Containers spend less time in port, so more can move through. |
|
Maximize moves per hour |
Cranes work more and ships finish faster. |
|
Align crane cycles |
Ships stay at the dock for less time and work is smoother. |
AI-powered scheduling can help cranes work up to 20 percent better. This keeps the port working well.
Key KPI criteria for port performance
You can watch some important numbers to see how well hoist speed and cranes work:
-
Crane moves per hour (CMPH)
-
Mean move between failures (MMBF)
-
Mean time to repair (MTTR)
-
Hoist, trolley, gantry, and boom movement speeds
There are problems like load sway, changes in cycle time, and safety risks. New tools help fix these problems:
-
Anti-sway systems use sensors to keep loads steady.
-
Smart control systems help cranes lift by themselves and stop delays.
-
Load control systems change speed to make lifting safe and smooth.
CEGC follows market rules and can change projects to fit your port. You can use a kpi template to check, study, and make your crane work better.
Building a container gantry crane: hoist speed KPI template
Essential template components
When you build a container gantry crane: hoist speed kpi template, you need to include several key parts. These parts help you track, compare, and improve crane performance in your port. Here are the main elements you should use:
-
Target Hoist Speed: This is the speed you want your crane to reach during lifting and lowering.
-
Actual Hoist Speed: This shows the real speed your crane achieves during each operation.
-
Variance: This is the difference between the target and actual speeds. It helps you spot problems quickly.
-
Measurement Interval: You choose how often you check the speeds, such as every shift or every day.
-
Responsible Operator: You record which operator is running the crane for each shift.
-
Date and Time: You log when you collect the data.
-
Comments/Notes: You can add notes about special events, weather, or maintenance.
You can also add other fields, like crane ID, container weight, and wind speed. These details help you understand why speeds change in your live port environment.
Step-by-step template creation
You can create a container gantry crane: hoist speed kpi template by following these steps:
-
Define Your Goals
Decide what you want to improve. You may want to increase throughput, reduce downtime, or make operations safer. -
Select Your Metrics
Choose which validation metrics matter most. For hoist speed, focus on target speed, actual speed, and variance. -
Design Your Template Format
Use a simple table or spreadsheet. Make sure it is easy for any operator to fill out. Here is a sample layout:Date
Crane ID
Operator
Target Speed (m/min)
Actual Speed (m/min)
Variance
Notes
2024-06-01
CGC-01
John D.
120
115
-5
Windy morning
-
Set Review Intervals
Decide how often you will review the data. For hoist speed, daily checks work best. The table below shows how often you should review different KPIs in your port:KPI Type
Operational (CMPH)
Daily or Weekly
Financial (Gross Margin)
Monthly
Hoist Speed
Daily
-
Assign Responsibilities
Make sure each operator knows who fills out the template and who reviews it. -
Train Your Team
Show your team how to use the template. Explain why each field matters. -
Start Tracking and Adjusting
Begin collecting data. Use the results to make changes and improve your port’s performance.
Data tracking and analysis in port settings
You need to track and analyze your container gantry crane: hoist speed kpi template data to see real results. Here are some best practices:
-
Collect Data Consistently
Always use the same method and intervals. This makes your validation metrics reliable. -
Review Data Regularly
Look at your hoist speed numbers every day. This helps you catch problems early. -
Analyze Trends
Watch for patterns. If you see slowdowns, check for causes like wind, heavy loads, or operator changes. -
Act on Findings
Use your data to make changes. For example, if one operator always gets better speeds, share their methods with others. -
Report Results
Share your findings with your team and management. This keeps everyone focused on improvement.
When you use a structured container gantry crane: hoist speed kpi template, you can see big gains. Studies show that crane productivity and service time can improve by 30–50 percent. Ship service time can drop by 51 percent. You can also see a 15 percent increase in throughput, a 20 percent reduction in turnaround time, and up to 30 percent less downtime.
You may face some challenges in your port. Physical limits like berth length and yard layout can restrict crane moves. Weather, such as wind and tide, can slow down your cranes. Port congestion can cause longer container dwell times. Scheduling gets harder with more containers and bigger ships. Sometimes, cranes must wait for each other, which can slow down the whole process.
CEGC’s solutions help you overcome these problems. You get anti-sway systems, smart controls, and easy-to-use templates. These tools help you track validation metrics and keep your port running smoothly.
Example KPI template for container gantry cranes
Here is a sample container gantry crane: hoist speed kpi template you can use in your port:
|
Date |
Crane ID |
Operator |
Target Hoist Speed (m/min) |
Actual Hoist Speed (m/min) |
Variance |
Container Weight (t) |
Wind Speed (m/s) |
Notes |
|---|---|---|---|---|---|---|---|---|
|
2024-06-01 |
CGC-01 |
John D. |
120 |
115 |
-5 |
30 |
8 |
Windy, light rain |
|
2024-06-01 |
CGC-02 |
Maria S. |
130 |
128 |
-2 |
32 |
5 |
Normal operation |
|
2024-06-01 |
CGC-03 |
Alex P. |
125 |
120 |
-5 |
28 |
7 |
Heavy traffic nearby |
Tip: You can add more columns for digital twin data or extra validation metrics if you want to track more details.
When you use this container gantry crane: hoist speed kpi template, you help your port work better. You make it easier for every operator to see what works and what needs fixing. CEGC can help you set up templates that fit your port’s needs and connect with your digital twin systems. This way, you always have the right validation metrics and can keep improving your live port environment.
You can make your port work better by using a hoist speed KPI template. This template helps you track important numbers:
|
Metric |
Importance |
|---|---|
|
Shows how well cranes move cargo. This is key for making the port run smoothly. |
|
|
Berth Occupancy Rate (BOR) |
Tells you how much the port uses its berths. This helps pay for port costs. |
-
KPIs change port goals into simple numbers.
-
You find port slowdowns quickly.
-
Even small fixes can help your port a lot.
CEGC makes special solutions for your port. Your template can work in any port setting.
FAQ
What is a hoist speed KPI?
A hoist speed KPI measures how fast your crane lifts or lowers containers. You use it to check crane performance and improve port operations.
How often should you review hoist speed data?
You should review hoist speed data every day. This helps you spot problems early and keep your port running smoothly.
Can you customize the KPI template for your port?
Yes! You can add fields like wind speed, container weight, or operator name. CEGC helps you match the template to your port’s needs.


